
No products in the cart.
Motivation
Year Over Year (YoY) – The Important Metric Explained

29
May
May
There are many metrics that economists use when evaluating the performance of a company, market index, mutual fund, or any other financial or business entity. These help them get a better sense of the potential profitability and allow them to determine if the investment is a good one. One such metric is year-over-year or YoY. This staple comparison is present in almost every price chart, regardless of the market or sector. However, not everyone knows what YoY represents and why it is so important. So, today, we will be looking at year-over-year (YoY) and examining why it is so crucial.
What Is Year-Over-Year (YoY)
Year-over-year is a metric that compares a company or other financial entity’s performance for a given period of one year against the same period for the previous year. For example, you can use year-over-year to compare a stock’s performance in quarter 3 of 2021 against its performance during quarter 3 of 2020. This can also be applied to any other operation, be it financial or not.
By looking at the year-over-year, you can determine how the company is performing compared to the same time from the previous year. This can give you a sense of its overall performance and whether it is improving in the long run. However, a simple increase in the year-over-year does not necessarily mean an improvement in the long term.
While the YoY for 2021 and 2020 might be positive, it could be less than the one for 2020 and 2019. If, for example, the YoY for 2020-2021 is a 5% increase, you might think that that is good. However, if the YoY for 2019-2020 were 15%, that would mean a 10% decrease in the YoY. As such, there would be a decline in the overall year-over-year performance. This would signal a problem to both investors and managers.
Why Is YoY So Useful?
Year-over-year is one of the simplest yet most powerful tools for gauging performance. By looking at a company’s YoY, you can determine how it has performed over the years. As such, you can easily see whether it is improving and by how much.
While YoY is very useful for investors and financiers, the metric is also a powerful tool for managers. Since year-over-year can be applied to anything, it can be used to monitor profits, costs, output, process efficiency, and various other performance data. If a negative or diminishing YoY is present, managers can narrow down the issue and improve the organizational structure.
Year-over-year is also applicable to a period of any size within a year. As such, it is particularly useful for monitoring performance during key periods of the fiscal year. For example, the holiday rush during the fourth quarter is a particularly important time for retail stores. By looking at their YoY for Q4, such businesses can determine how they have performed compared to previous holiday seasons.
How Is Year-Over-Year Calculated?
Part of what makes year-over-year such a powerful tool is its simplicity. YoY requires minimal math skills, and anyone with the right data can easily calculate it. As such, year-over-year is an essential metric to consider, regardless of whether you are looking to invest or monitor your business’ performance.
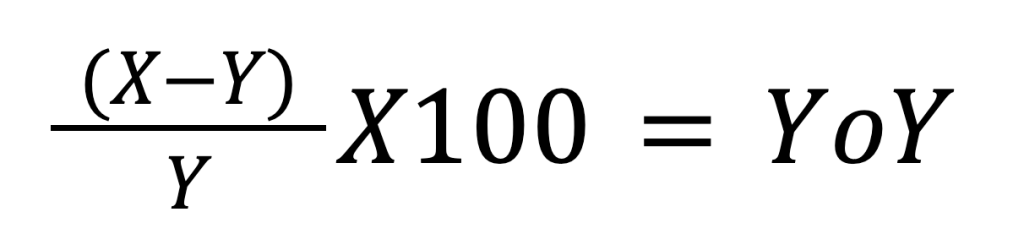
Year-over-year usually appears as a percentage value. In order to calculate YoY, you simply need to take the value from one year and subtract the same value from a previous year from it. Next, you need to divide the resulting number by the value you used from a previous year. Finally, you will need to multiply the result by 100 in order to convert it to a percentage value.
Let’s say that company X made $150,000 in profits during Q3 of 2021. Meanwhile, during Q3 of 2020, the same company earned a profit of $125,000. In order to determine the YoY for Q3, you will first need to subtract 125,000 from 150,000. This results in 25,000. You then need to divide that by 125,000, resulting in 0.2. Once you have done that, multiply the result by 100. Now you can see that the profits for Q3 grew by 20% year-over-year.
How To Calculate YoY In Excel?
Microsoft Excel is one of the most popular and widespread data processing programs in the world. It allows users to build extensive spreadsheets, utilizing powerful tools and equations. As such, many businesses of all sizes use the suit to manage their operations. However, Excel is not only limited to enterprises, as many individuals use the program to manage personal finances or other data.
Because of its popularity and widespread adoption, Excel is one of the most common programs used to calculate year-over-year. Thankfully, this is quite simple due to the software’s simple and intuitive design. All you need to calculate YoY in a spreadsheet is the abovementioned equation and some basic Excel skills. Here are the basic steps necessary to calculate year-over-year in Microsoft Excel:
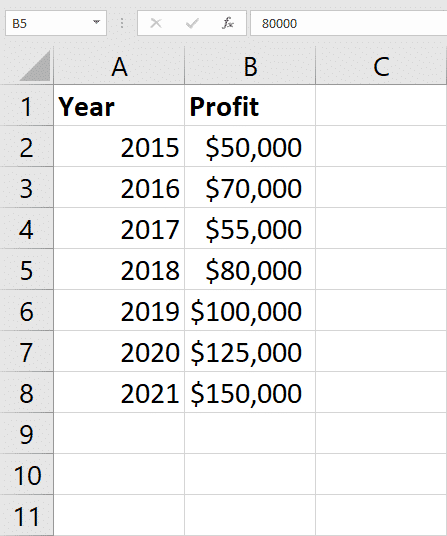
Input Your Data Into Excel
This is pretty straightforward. In order to calculate year-over-year, you will first need to input your existing data into Excel. This means that you will need to create two columns. One with the time periods you are comparing and one with the corresponding metrics for each period. For example, one column can contain different years, while the other can contain the yearly profit for each one.
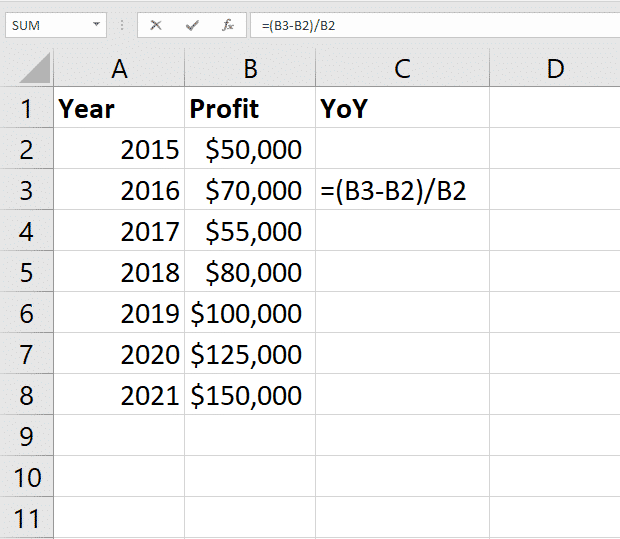
Create A Column For Year Over Year Calculations
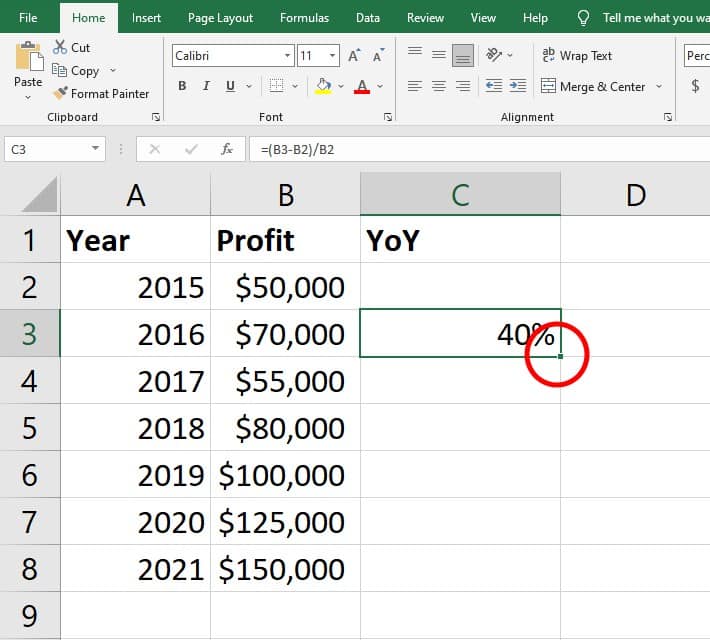
Next, you will need to create a column where the YoY calculations will take place. Here, you will need to input the YoY equation into the Formula Bar above the spreadsheet. Instead of entering each value by hand, you can hold the Ctrl button and click on a cell to mark it and its value. As such, the equation, in this case, should look like this- C3=(B3-B2)/B2. We need to start with 2016 as there is no data prior to 2015 to calculate a YoY for that year.
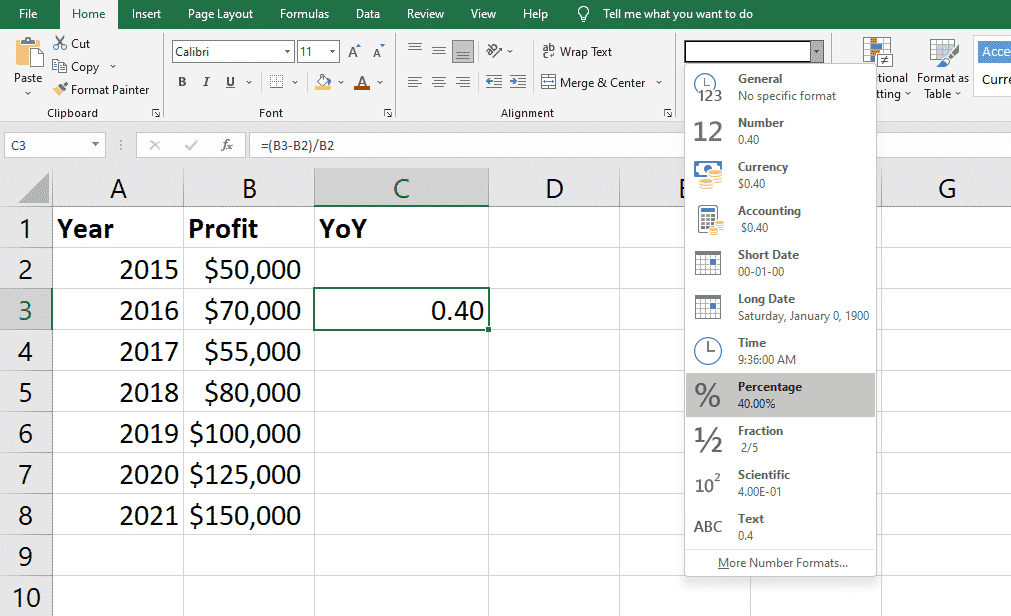
Convert Results To Percent
Once you press enter, the result of the equation will appear in the cell. However, this might not be a percentage value. In order to convert the cell to a percentage, you need to select it. Then, navigate to the Numbers section of the Home tab and select percentage in the drop-down menu.
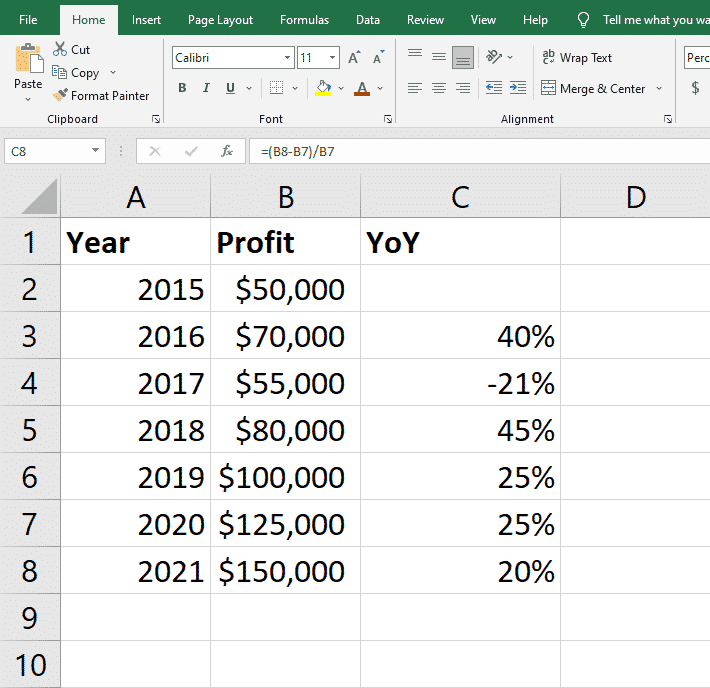
Use The AutoFill Feature To Automatically Calculate The Rest
Microsoft Excel has a handy feature called AutoFill. This allows you to quickly perform the same action in multiple cells. However, since it is “smart”, it automatically adjusts the equation to the new cell’s requirements. In order to do this, first select the cell where we already performed the calculation. In our case, that is C3. Now, click and hold on to the little square in the bottom-right corner of the cell.
Once you have clicked on it, drag your mouse over the cells where you want to repeat the equation. If done correctly, the equation should automatically be applied to all selected cells. The results will also appear automatically. You can check these by selecting each cell and looking at the formula bar to determine if the equation is correct.
Conclusion
All in all, year-over-year is one of the staple metrics when it comes to performance monitoring. Regardless of whether you are looking at a company’s performance, a stock’s value, or any other metric that changes over time, you can easily apply YoY to gouge efficiency across years. This will allow you to keep an eye on an organization’s performance and take appropriate steps.
Because of its flexibility, year-over-year is applied across all industries and markets. In the financial sector, investors and financiers can use the equation to gauge a company or other potential investment’s performance. This gives them a perspective of its viability as an investment option and allows them to make more informed decisions. Meanwhile, managers and executive staff can use the metric to determine how their organization or workers are performing. This allows them to pinpoint and tackle issues more easily.
Regardless of what industry or sector you might be in, year-over-year is an invaluable tool in anyone’s skill set. Even if you do not plan on using it in your professional life, it can easily be applied to personal matters as well. Using YoY allows you to compare income, expenses, and various other variables in your daily life. Learning how to properly apply year-over-year is always a good idea, regardless of how you plan to use it.
Read Next: Shiba Inu Price Predictions
Source link